mirror of
https://codeberg.org/forgejo/forgejo.git
synced 2025-10-26 12:01:08 +00:00
This PR adds gitea-mixin, configurable Grafana dashboards (and potentially prometheus alerts+recording rules) based on Gitea [metrics](https://docs.gitea.io/en-us/config-cheat-sheet/#metrics-metrics). The overview dashboard is described using jsonnet and grafonnet library: https://grafana.github.io/grafonnet-lib/ Mixins help to define dashboard and alerts as code so they can be collaboratively improved by the users. 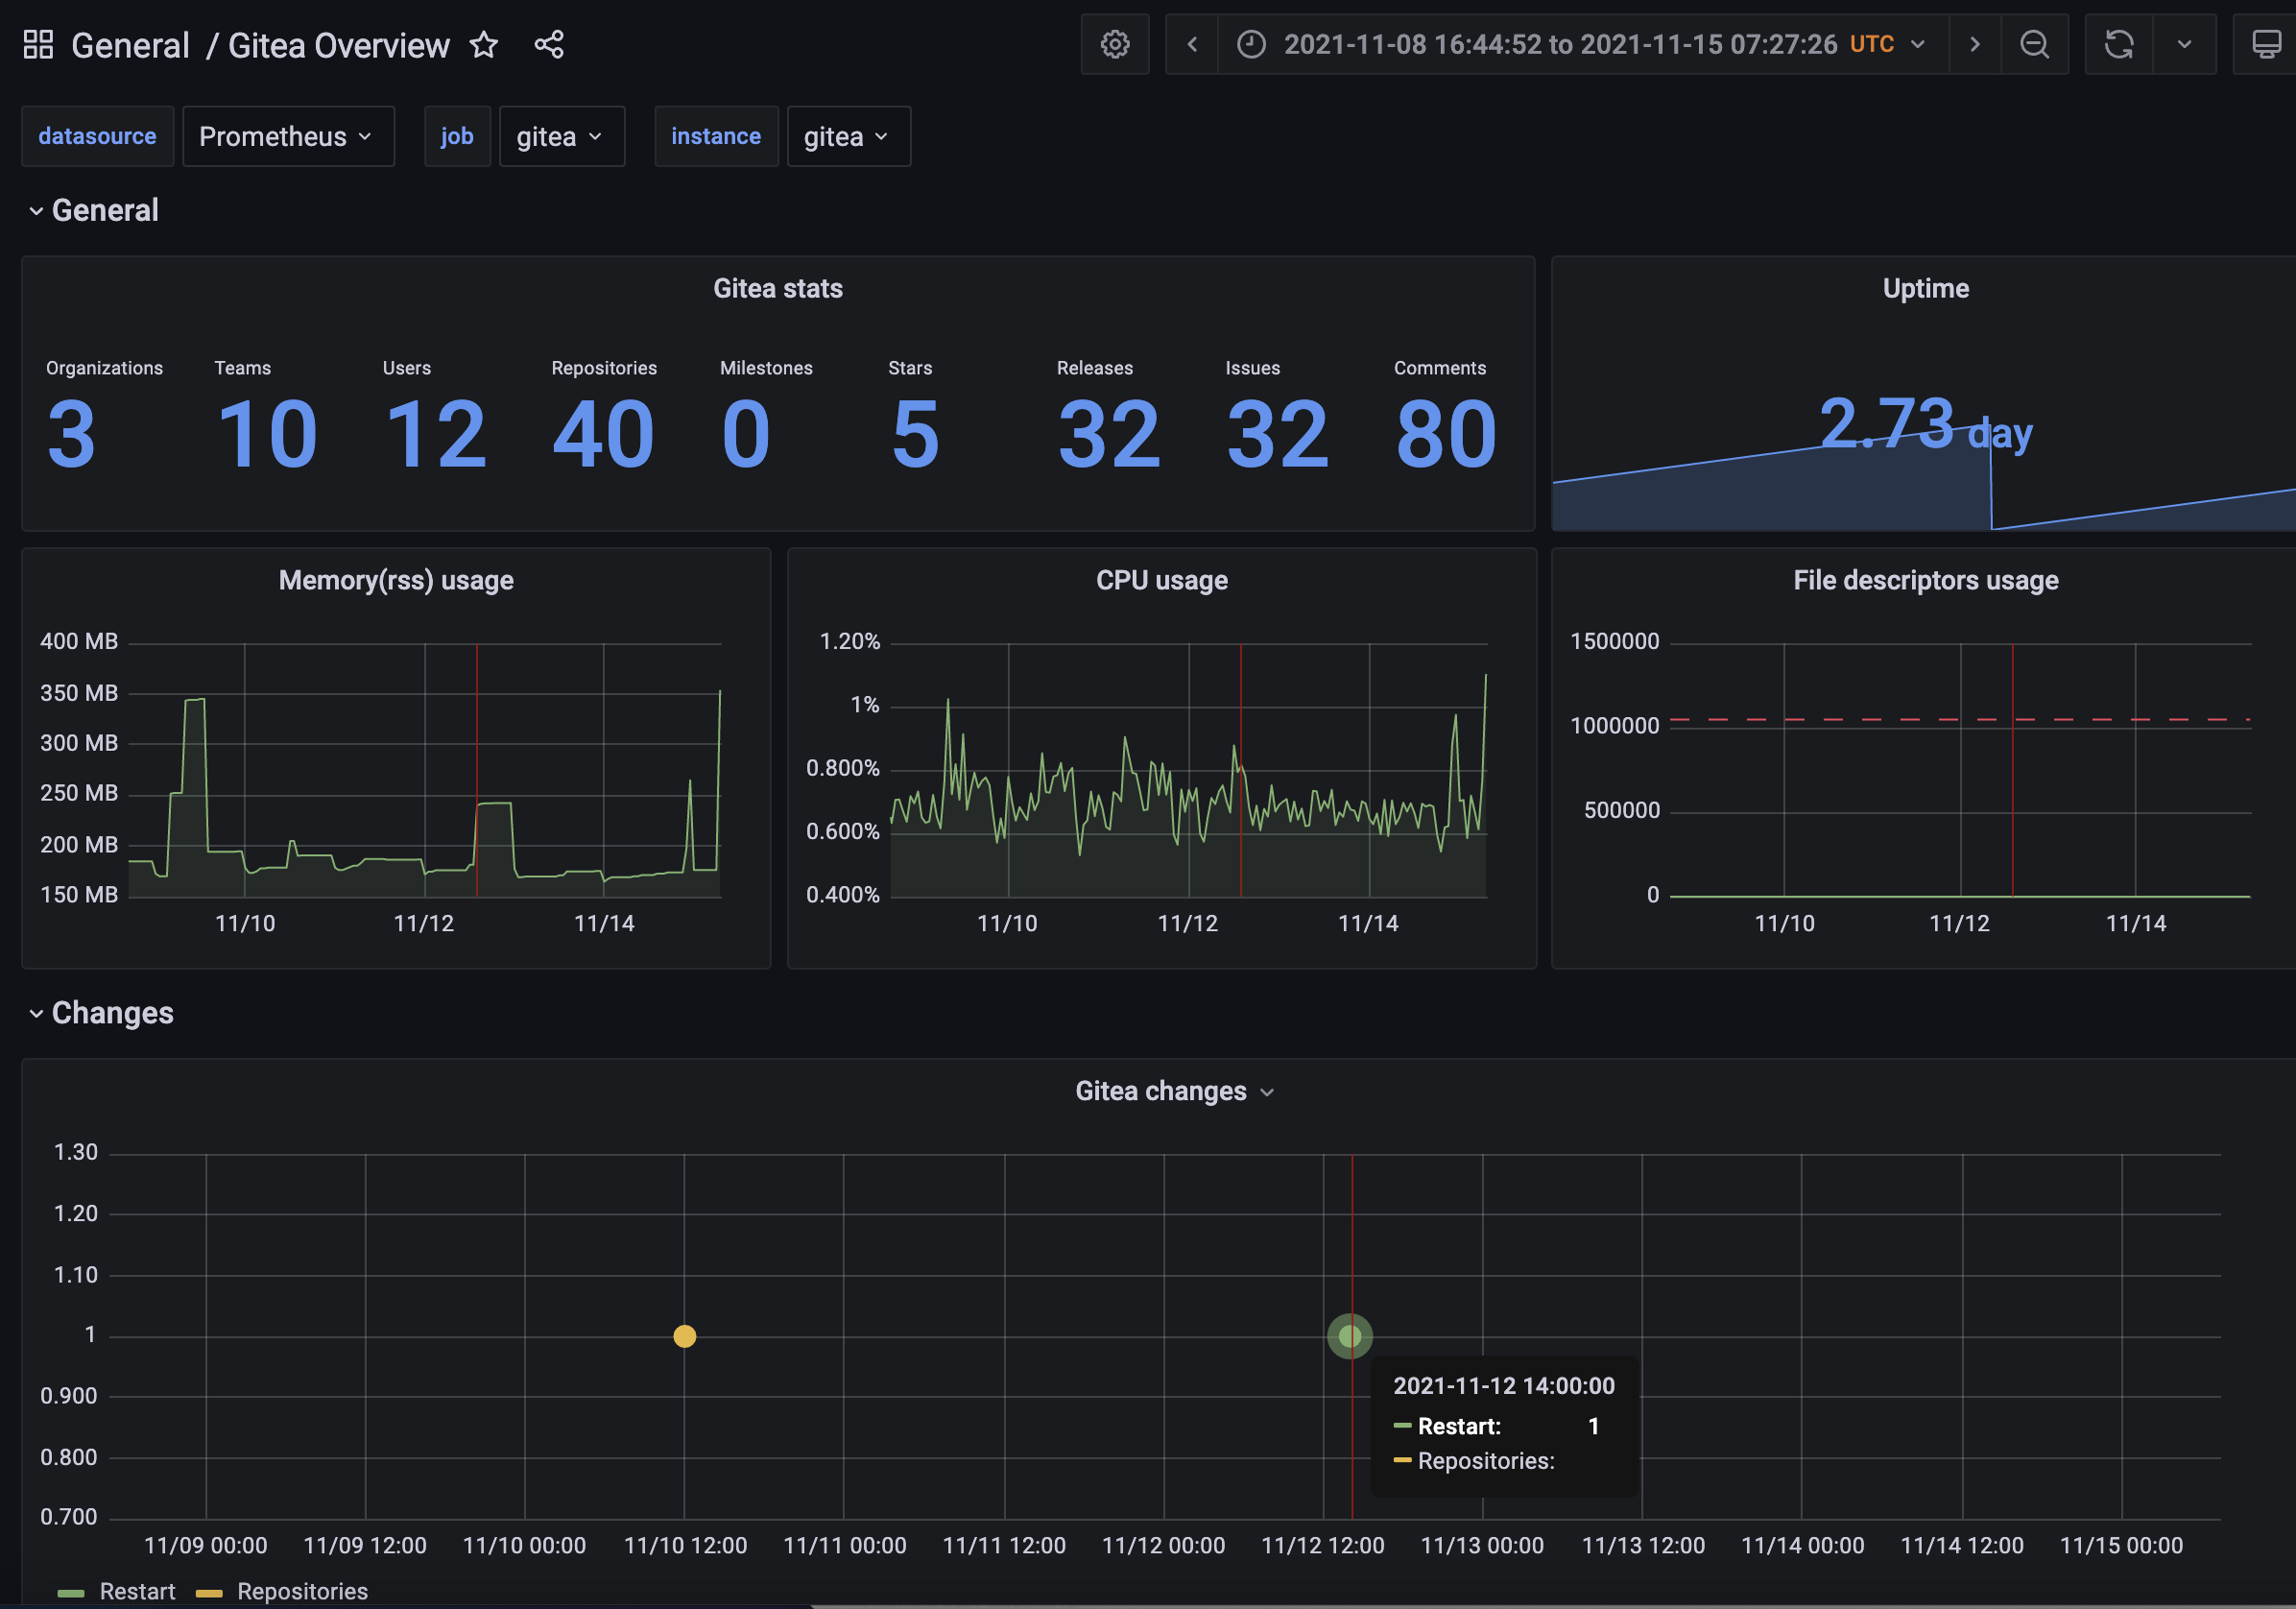 __ ## Generate config files You can manually generate dashboards, but first you should install some tools: ```bash go get github.com/jsonnet-bundler/jsonnet-bundler/cmd/jb go get github.com/google/go-jsonnet/cmd/jsonnet # or in brew: brew install go-jsonnet ``` For linting and formatting, you would also need `mixtool` and `jsonnetfmt` installed. If you have a working Go development environment, it's easiest to run the following: ```bash go get github.com/monitoring-mixins/mixtool/cmd/mixtool go get github.com/google/go-jsonnet/cmd/jsonnetfmt ``` The files in `dashboards_out` need to be imported into your Grafana server. The exact details will be depending on your environment. Edit `config.libsonnet` (for example, list of Gitea metrics to be shown under stats can be adjusted). if required and then build JSON dashboard files for Grafana: ```bash make ``` For more about mixins, please see: https://github.com/monitoring-mixins/docs https://www.youtube.com/watch?v=GDdnL5R_l-Y* add gitea mixin * remove alerts/rules * gitea-mixin: add interval factor of 1/2 to remove duplicated change events * gitea-mixin: fix changes panel, add aggregation interval for changes panel * gitea-mixin: add totals singlestat * gitea mixin: switch change graph to timeseries type * add color overrides for issue labels * bump grafonnet version * gitea-mixin: convert graphs to timeseries * gitea-mixin: make fmt * gitea-mixin: add .PHONE in Makefile * gitea-mixin: add time configration * gitea-mixin: make fmt and collapse addPanel grid * gitea-mixin: add static ids for shared panels * gitea-mixin: add flags showIssuesByRepository, showIssuesByLabel to show/hide corresponding panels * gitea-mixin: update aggregation interval * gitea-mixin: update defaults * gitea-mixin: update panel names * rename dir to gitea-monitoring-mixin * gitea-mixin: add gitea_issues_open, gitea_issues_closed metrics * gitea-mixin: update visible name for datasource * gitea-mixin: update README Co-authored-by: Lunny Xiao <xiaolunwen@gmail.com> Co-authored-by: zeripath <art27@cantab.net>
99 lines
2.3 KiB
Jsonnet
99 lines
2.3 KiB
Jsonnet
{
|
|
_config+:: {
|
|
local c = self,
|
|
dashboardNamePrefix: 'Gitea',
|
|
dashboardTags: ['gitea'],
|
|
dashboardPeriod: 'now-1h',
|
|
dashboardTimezone: 'default',
|
|
dashboardRefresh: '1m',
|
|
|
|
// please see https://docs.gitea.io/en-us/config-cheat-sheet/#metrics-metrics
|
|
// Show issue by repository metrics with format gitea_issues_by_repository{repository="org/repo"} 5.
|
|
// Requires Gitea 1.16.0 with ENABLED_ISSUE_BY_REPOSITORY set to true.
|
|
showIssuesByRepository: true,
|
|
// Show graphs for issue by label metrics with format gitea_issues_by_label{label="bug"} 2.
|
|
// Requires Gitea 1.16.0 with ENABLED_ISSUE_BY_LABEL set to true.
|
|
showIssuesByLabel: true,
|
|
|
|
// Requires Gitea 1.16.0.
|
|
showIssuesOpenClose: true,
|
|
|
|
// add or remove metrics from dashboard
|
|
giteaStatMetrics:
|
|
[
|
|
{
|
|
name: 'gitea_organizations',
|
|
description: 'Organizations',
|
|
},
|
|
{
|
|
name: 'gitea_teams',
|
|
description: 'Teams',
|
|
},
|
|
{
|
|
name: 'gitea_users',
|
|
description: 'Users',
|
|
},
|
|
{
|
|
name: 'gitea_repositories',
|
|
description: 'Repositories',
|
|
},
|
|
{
|
|
name: 'gitea_milestones',
|
|
description: 'Milestones',
|
|
},
|
|
{
|
|
name: 'gitea_stars',
|
|
description: 'Stars',
|
|
},
|
|
{
|
|
name: 'gitea_releases',
|
|
description: 'Releases',
|
|
},
|
|
]
|
|
+
|
|
if c.showIssuesOpenClose then
|
|
[
|
|
{
|
|
name: 'gitea_issues_open',
|
|
description: 'Issues opened',
|
|
},
|
|
{
|
|
name: 'gitea_issues_closed',
|
|
description: 'Issues closed',
|
|
},
|
|
] else
|
|
[
|
|
{
|
|
name: 'gitea_issues',
|
|
description: 'Issues',
|
|
},
|
|
],
|
|
//set this for using label colors on graphs
|
|
issueLabels: [
|
|
{
|
|
label: 'bug',
|
|
color: '#ee0701',
|
|
},
|
|
{
|
|
label: 'duplicate',
|
|
color: '#cccccc',
|
|
},
|
|
{
|
|
label: 'invalid',
|
|
color: '#e6e6e6',
|
|
},
|
|
{
|
|
label: 'enhancement',
|
|
color: '#84b6eb',
|
|
},
|
|
{
|
|
label: 'help wanted',
|
|
color: '#128a0c',
|
|
},
|
|
{
|
|
label: 'question',
|
|
color: '#cc317c',
|
|
},
|
|
],
|
|
},
|
|
}
|